
E-commerce Profit Analytics: The Only KPIs That Matter for COD Merchants
Revenue is vanity, profit is sanity. Discover which COD e-commerce metrics drive real growth: confirmation rate, delivery rate, profit per order, and more.
Revenue Is Not the Metric You Think It Is
Most e-commerce merchants track revenue religiously. Revenue goes up — celebrate. Revenue goes down — panic. Decisions get made based on the revenue line.
This is a mistake.
A store doing $100,000 per month in revenue could be losing money. A store doing $30,000 per month could be the most profitable operation you've ever run. Revenue tells you how much moved. Profit tells you how much you actually made.
The merchants who scale successfully are the ones who replace their revenue obsession with a profit obsession — and they get there through better analytics.
The Metrics That Actually Matter
1. Profit Per Order
Not revenue per order. Not gross margin. Actual profit per order — after product cost, packaging, shipping to the customer, and return shipping (weighted by your return rate).
How to calculate it:
Profit per order = Sale price
  - Product cost
  - Packaging cost
  - Outbound shipping cost
  - (Return rate × Return shipping cost)
  - (Return rate × Product restocking cost)
Most merchants who calculate this for the first time are surprised. Some products with high revenue per order have negative profit once returns are factored in.
Saleura calculates this automatically per order, per product, and per delivery company — so you always know which orders are actually making you money.
2. Confirmation Rate
Already covered in detail elsewhere, but it belongs in any analytics framework. A 1% improvement in confirmation rate on 1,000 orders per month = 10 more confirmed orders = 10 more potential deliveries.
Track it daily, by product and by traffic source.
3. Delivery Rate
The percentage of shipped orders that are successfully delivered. The inverse — refusal rate — is your return rate at the final mile.
A high confirmation rate combined with a low delivery rate signals a problem at the delivery stage: customer not home, address issues, or delivery company underperformance in certain regions.
Track delivery rate by city and by delivery company. You will almost certainly find that one delivery company underperforms in certain areas — and that data lets you make routing decisions that save money.
4. Revenue Per Delivery Attempt
This is a composite metric that captures your full funnel efficiency:
Revenue per delivery attempt = Revenue collected ÷ Total delivery attempts
If you make 1,000 delivery attempts and collect revenue on 720 of them, your revenue per attempt tells you exactly how much each shipping slot is worth — and whether the economics work.
5. Return Rate by Product
Not just overall return rate. By product. This is where the actionable insight lives.
A product with a 40% return rate is a liability. It's burning delivery attempts, product inventory, and your delivery company relationship. You need to know which products are doing this — not as an aggregate, but individually.
Pull a product-level return rate report. The bottom 20% of products by return rate are usually responsible for 60–70% of your total return volume.
6. Agent Confirmation Rate
If you have a human confirmation team (or a mix of human and AI), track confirmation rate per agent. This metric tells you:
- Who your best performers are (to learn from)
- Who needs coaching
- Whether your overall confirmation rate drop is caused by a process problem or a people problem
A 15-point gap between your best and worst agent is a training opportunity, not a personnel problem. Most of the time.
The Four Analytics Reports Every E-commerce Operator Needs
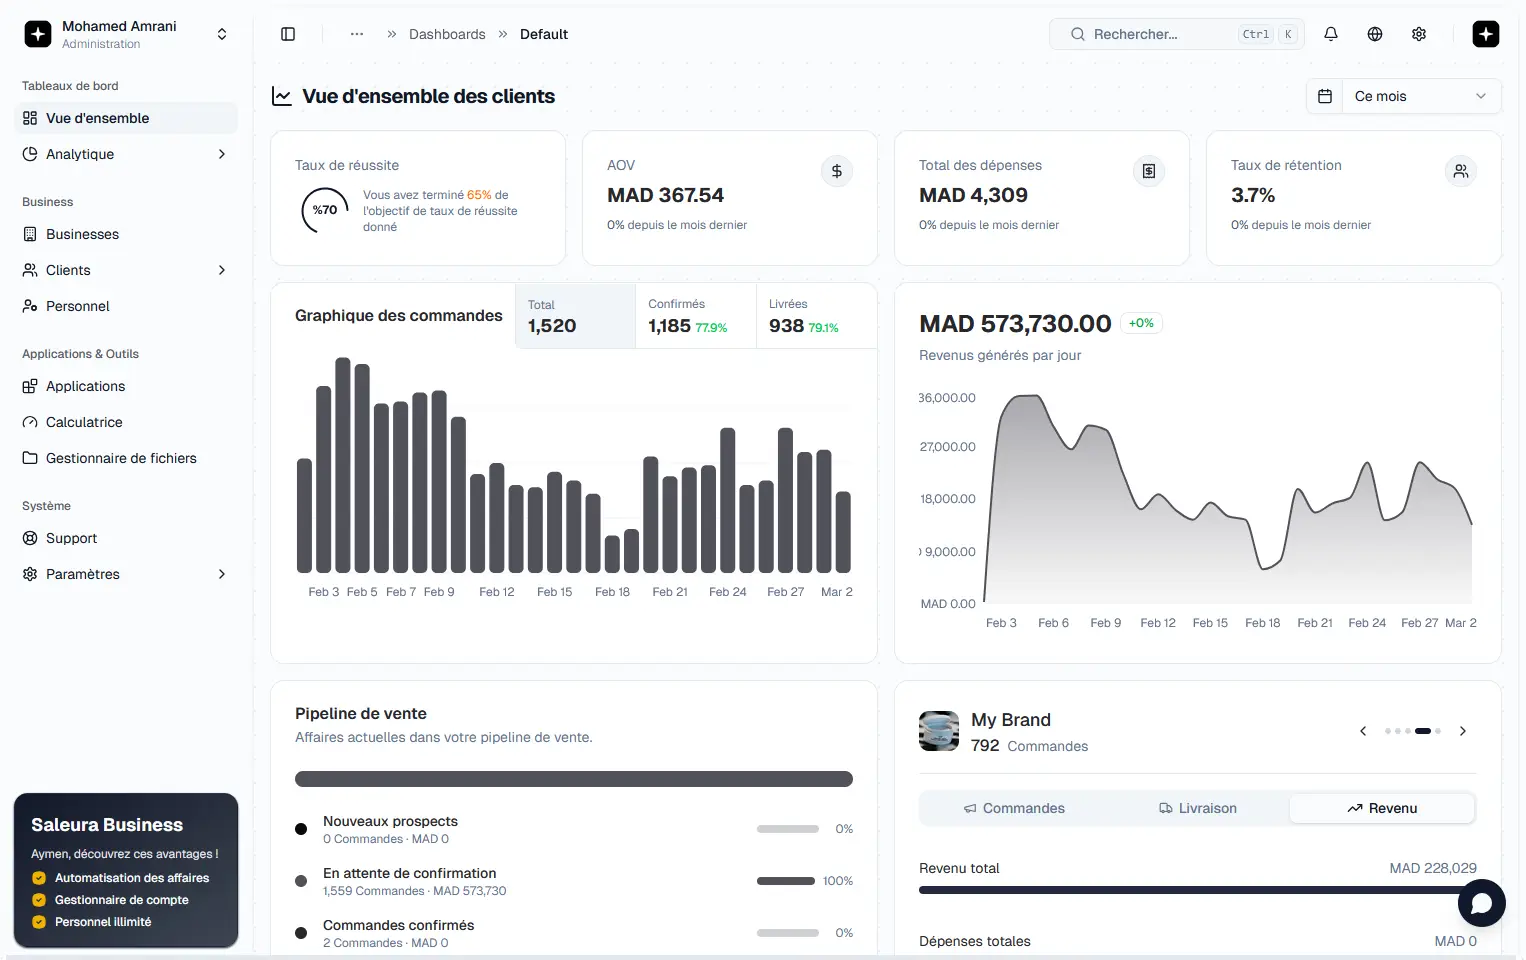
Report 1: Daily Operations Dashboard
What it shows: Orders placed, orders confirmed, orders shipped, orders delivered — today vs. yesterday vs. last week.
Why you need it: Instant pulse on your operation. Any anomaly — confirmation rate dropping, delivery failures spiking — shows up immediately instead of being discovered at the end of the month.
Report 2: Product Performance Report
What it shows: Per product — revenue, profit, confirmation rate, return rate, margin.
Why you need it: Identifies which products to scale (high margin, low return), which to fix (high return, potentially fixable), and which to cut (negative margin after returns).
Report 3: City/Region Performance Report
What it shows: Per city — order volume, delivery rate, return rate, delivery cost, profit.
Why you need it: Some cities are profitable. Some are money-losing due to high return rates and expensive re-delivery costs. Without this report, you're subsidizing bad regions with profits from good ones. With it, you can adjust shipping policies, add city-specific confirmation steps, or stop shipping to unprofitable zones entirely.
Report 4: Team Performance Report
What it shows: Per agent — orders handled, confirmation rate, calls made, average handle time.
Why you need it: Accountability and optimization. Your confirmation team's performance directly drives your revenue. Measure it like it matters — because it does.
How to Act on the Data
Data without action is just noise. Here's how to turn analytics into decisions:
If product return rate > 25%: → Review product photos and description for accuracy → Listen to 10 confirmation call recordings for this product → Check if one ad creative is generating low-quality buyers
If city delivery rate < 60%: → Compare across your delivery companies for that city → Consider switching providers or adding a local delivery option → Add an out-for-delivery notification specifically for that city
If agent confirmation rate < 65%: → Shadow their calls for one day → Review their most recent 20 call recordings → Compare their approach to your top performer's
If profit per order is declining despite stable revenue: → Check if your product cost has increased → Check if delivery company fees have changed → Check if your return rate has increased
From Spreadsheets to Real-Time Dashboards
The merchants doing all of this analysis manually — pulling reports, combining spreadsheets, building pivot tables — spend 5–10 hours per week on analytics alone. And the data is always a day or two old.
Saleura consolidates all of this into a single real-time dashboard. Every metric above is calculated automatically from your live order data. You open the app and the answers are there — no pulling, no combining, no waiting.
The goal isn't more data. It's faster decisions made from better data. That's the difference between an e-commerce operation that scales and one that stays stuck.
Related blogs
Related Post
Expand your knowledge with these hand-picked posts.

How to Reduce COD Return Rates: Proven Strategies to Recover Your Margins
High COD return rates are silently killing your margins. Learn how to cut returns 50%+ using confirmation automation, blacklisting, and proactive delivery alerts.
Karim Mansour

AI Order Confirmation for COD E-commerce: Boost Your Rate to 80%+
See how AI calling agents confirm COD orders 24/7, handle objections automatically, and push confirmation rates from 55% to 80%+ without extra staff.
Sara El-Amine

How to Manage Multiple E-commerce Stores: A COD Operator Guide to Scaling
Managing 2+ online stores from separate tools is a chaos trap. Learn how to unify operations, separate teams, and scale multi-brand e-commerce cleanly.
Omar Tazi
واش مستعد تكبر تجارتك؟
نضم لتجار التجارة الإلكترونية اللي كيخدمو Saleura باش يأكدو بزاف من الطلبات وينقصو نسبة المرتجعات ويزيدو الأرباح — مشي غير الإيرادات.